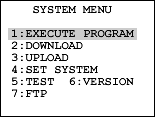
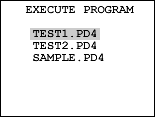
Here we run the user application program on the BHT and debug program operation.
The description of executing and debugging proceeds in the following order.


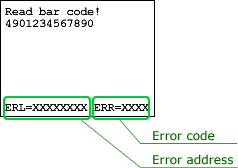
This approach checks whether the user application program runs as intended on the target BHT. A run-time error suspends the user application program and displays the error address(ERL) and an error code (ERR).

Use the error address and error code to determine the source of the error and modify the source code accordingly.
For further details on run-time error codes, refer to Appendix A1 "Run-time Errors" in the BHT-BASIC Programming Manual.
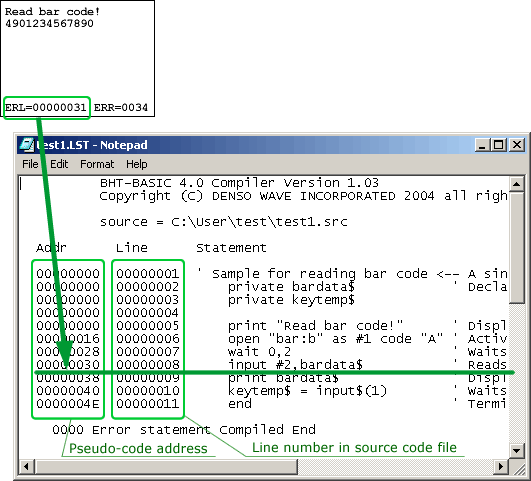
The error address is a pseudo-code address giving the location for the error in the listing file, compiler output with the file extension .LST. Finding that line in the listing file gives the corresponding line number in the original source code file.

For further details, refer to Chapter 2 "Development Environment and Procedures" in the BHT-BASIC Programming Manual.
The remote debugger provides single-step (by line) execution, breakpoints, and other facilities for monitoring the program's execution status. It also speeds debugging by providing access to variables used and the stack.
For further details, refer to the Remote Debugger User's Guide.
If you have not registered
The services on this member site are available only for registered customers.