
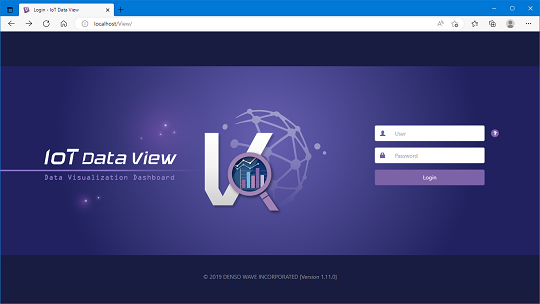
Data visualization dashboard
to present the collected data easily
without programming
Control referable information and executable functions according to the login level.
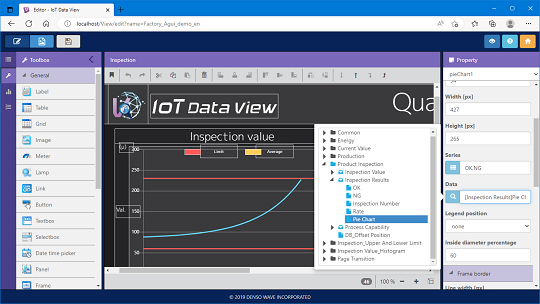
Create dashboard screen instinctively by drag and drop.
● Label: Output data as a text
● Image: Import image and show as background image or output image
● Lamp: Change the color according to the data
● Graph: Output data graph (selectable from bar, line or pie)
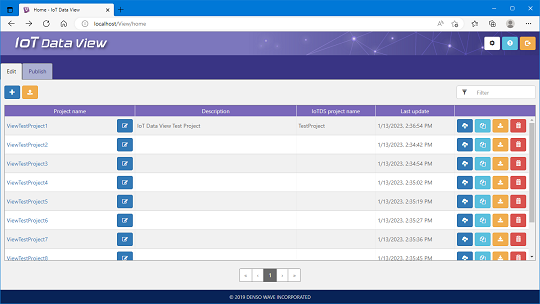
Manage the created dashboard in a list.
Dashboard design can be easily shared by using download/upload function.
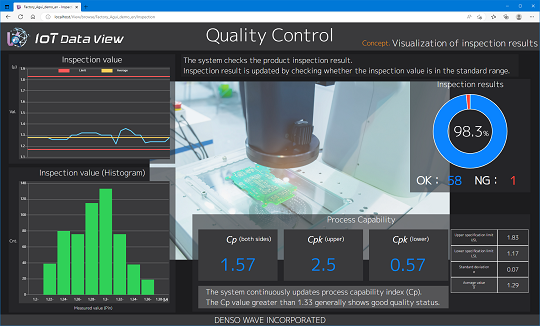
Created dashboard can be displayed on the supported browser.
No additional software installation is required on client PC.
| OS | Windows 11 | Pro |
|---|---|---|
| Pro for Workstations | ||
| Enterprise | ||
| Windows 11 IoT | Enterprise GAC | |
| Windows 10 | Pro | |
| Enterprise | ||
| Enterprise LTSC 2021 | ||
| Enterprise LTSC 2019 | ||
| Enterprise LTSB 2016 | ||
| Pro for Workstations | ||
| Windows 10 IoT | Enterprise GAC / SAC | |
| Enterprise LTSC 2021 | ||
| Enterprise LTSC 2019 | ||
| Enterprise LTSB 2016 | ||
| Windows 8.1 | Pro / Enterprise | |
| Windows 7 | Professional / Enterprise / Ultimate | |
| Windows Server 2022 | Standard / Datacenter / Essentials | |
| Windows Server 2019 | Standard / Datacenter / Essentials | |
| Windows Server 2016 | Standard / Datacenter / Essentials | |
| Windows Server 2012 R2 | Standard / Datacenter / Essentials | |
| CPU | Intel® Core i3 2.4GHz or faster | |
| Memory | 4GB or more | |
| HDD | More than 2GB of free space | |
If you have not registered
The services on this member site are available only for registered customers.


 General Inquiries
 Technical Inquiries